
IELTS Academic Writing Task 1 In 5 Steps

Table of Contents
Writing Task 1
You must write 150 words for Academic Writing Task 1 of the IELTS about a process, a map, or data presented in the form of a bar chart, line graph, pie chart, or table. Many students struggle with this skill because they haven’t practised it before. Understanding how your essay will be graded and using that knowledge to write an essay that gives the examiner exactly what they want will help you perform well on IELTS Writing Task 1.
Follow these five simple steps, and you’ll be on your way to success!
- Understand the marking criteria
- Paraphrase the question
- Write an overview
- Support overview with detail
- Check your work
The task is made significantly simpler by breaking it up into smaller components. I’ll go over each of the five steps in greater detail below, followed by some sample responses so you can see how it actually works in the real world.
Please keep in mind that I will provide you with the opportunity to edit my work at the conclusion, so please do not be overly critical in the comments section if you find any errors. Intentional errors are made to highlight the importance of double-checking your work and giving people time to consider the solution.
The following Task 1 Question will be used to guide us:
Marking Criterion
| Task Achievement | 25% |
| Coherence and Cohesion | 25% |
| Lexical Resource | 25% |
| Grammatical Range and accuracy | 25% |
If you’re confused by any of these expressions, don’t worry; I’ll go over each one in more detail below and provide a clearer explanation of what it means. The official marking guidelines are available.
Task Achievement
Your capacity to respond to the question accurately is referred to as task achievement. To accomplish this, you must complete all of the tasks outlined in the question and then write an answer that is both concise and comprehensive.
You’ll achieve a higher grade if you:
- Select the main/key features of the graph, chart, map or process.
- Write a clear overview that includes the main/key features (main trends, differences, stages etc.) of the graph, chart, map or process.
- Support them with accurate detail.
- Write at least 150 words.
Coherence and Cohesion
The ability to connect your ideas in a logical and understandable manner is referred to as coherence. Most of this is done at the paragraph level. Do you have a logical flow to your paragraphs? Is there one main idea that stands out in each paragraph? Is it simple to understand each paragraph’s main idea?
A higher coherence rating will be awarded if you:
- Introduce your topic by paraphrasing the question in the first paragraph.
- Separate your ideas into paragraphs.
- Making it clear which paragraph is your overview.
- Having very clear ideas in your overview.
- Supporting the main points in your overview in separate paragraphs.
- Making it clear what each paragraph is about.
The connection of ideas at the sentence and paragraph levels is referred to as cohesion. Are your ideas and sentences cohesive?
Cohesion will be given a higher grade if you:
Utilise a variety of linking words when necessary.
Use precise linking language.
Avoid overusing conjunctions.
Lexical Resource
Your ability to use vocabulary appropriately and accurately is referred to as a lexical resource.
You’ll score better on the vocabulary test if you:
– Correctly answer the question.
– Use synonyms to change up your vocabulary.
– Avoid making lexical errors.
– correct your word spelling.
– To describe trends, comparisons, stages, changes, etc., use the appropriate vocabulary.
Grammatical Range and Accuracy
This refers to your capacity to use a variety of grammatical structures and write sentences free of errors.
You’ll achieve a higher grade if you:
Don’t make mistakes.
Use a variety of suitable tenses.
Use a variety of suitable structures.
Use both straightforward and intricate sentences.
Apply the proper punctuation.
Paraphrase The Question
We can give the examiners exactly what they want and avoid common mistakes that prevent people from receiving a high score now that we are aware of how the exam is scored.
In Task 1, we should always begin with a paraphrase of the question, This would be the paragraph 1 of the task which is also called ‘opening or an Introduction‘. When we rewrite a phrase or sentence using different words while maintaining the same meaning, we are said to be paraphrasing. We can accomplish this in a number of ways, but using synonyms is the most straightforward.
For Example
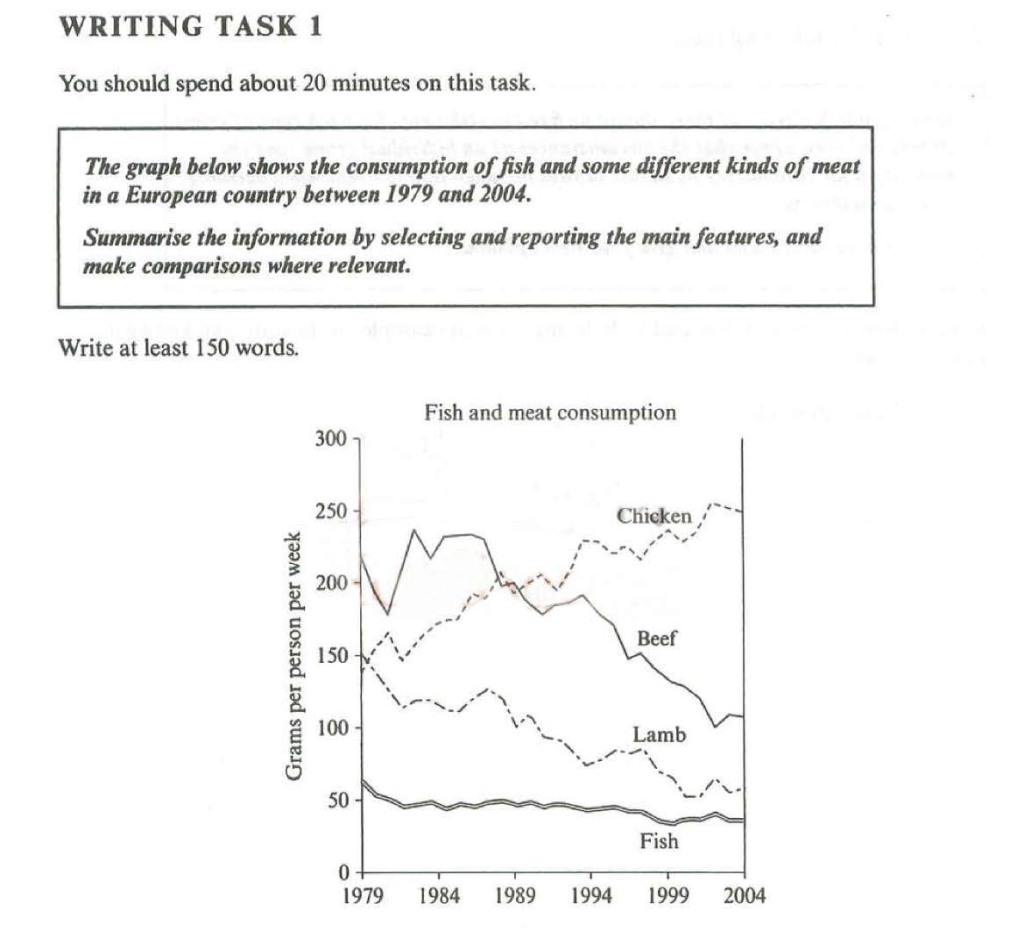
Lets paraphrase this question
Paraphrased – The given Line graph depicts the information about fish and varied type of meat eaten in a European nation between 1979 and 2004.
Synonyms we can use
Graph – line Chart
Shows – depicts/illustrates
consumption – Intake/ consumed/eaten
some different kind of – variety of/ varied type of
European Country – In Europe
So, by using a few straightforward synonyms, we were able to paraphrase the sentence and demonstrate to the examiner that we are proficient in this skill and possess a broad vocabulary, earning us two points towards a high score.
Your first paragraph should be this, and we should skip a line to signal to the examiner that we are beginning a new paragraph, the overview.
Overview
The overview is the most crucial paragraph in the entire essay, and writing a poor one will prevent you from receiving a high grade.
Academic Task 1 always asks the same question. It reads:
Summarise the information by selecting and reporting the main features, and make comparisons where relevant.
Examine the visual data and note the most important and obvious patterns, comparisons, or trends. Search for significant variations, the highest and lowest values, any outliers, and any intriguing or noteworthy data.
While examining look for
- a Striking factor of the graph
- a prominent trend
- Highest/ lowest data
- overall how graph is performing (its increasing, decreasing or is it unchanged)
Limiting their interests to just three or four things is a problem that many students experience. There is a tonne of information out there, and it can all seem pertinent.
Consider ways to make IELTS exam questions that are complicated simpler. To make this task simpler, consider how you would respond if someone asked you to describe the graph in just three words: what would they be? Thinking in this way forces you to stop examining all the information and concentrates your attention on identifying the key ideas.
In line graphs, it’s important to pay attention to what typically transpires between the start date and the end date.
Take another look at our example and identify the “main features.”
I have to say 3 general things about this
- Chicken and lamb consumption are contradicting
- People tend to consume more chicken and less of other meats
- Consumption of lamb and beef dropped significantly
- Consumption of fish slightly dropped and remained almost static
I’m done now. There’s no need to make it too complicated. Simply identify the three or four most obvious things.
We are now prepared to add our overview paragraph’s three key features. Typically, an overview paragraph will consist of two sentences that briefly describe the main points. Never use data from the overview to support the main features. Use only dates; don’t include any other numbers.
Our summary sentence will be as follows:
Overall, the most noticeable trend is the contradiction in the consumption of chicken with lamb and meat. Where Europeans preference for chicken increased over time, meat and lamb including fish witnessed a drop.
Support Overview with Detail
Supporting overview simply means writing a body paragraph that carries sufficient details about the graph. You must include the accurate data and present information is logical manner so as to make it clear for the reader to comprehend the graph.
Let’s check how we can add details and support the overview paragraph.
Note – It is not important to add each and every information you can skip some data and information that seems to be unimportant.
Let Have a look
-I would take chicken and lamb as their intake was same in 1979 this seems a great feature to introduce in the beginning and then i can easily compare and contrast them
– Consumption of chicken post 1979 continue to increase sharply while lamb recorded an decline in its consumption by 2004 250 gram per person per week chicken was eaten while around 50 gram per person per week lamb was consumed.
-Now we can talk about beef consumption in the beginning and how it was by the end .
– Finally about fish which had minimum consumption of approx 60 gram per person per week, that marginally dropped at remained at almost 50 gram till 2004.
Lets write it into a paragraph
“On analysis, Consumption of chicken and land in 1979 was almost equal with 150 gram per person per week. Post 1979, Europeans preference for chicken continue to increase and reached at 250 gram per person per week which was maximum. On the other hand, lamb witnessed a sharp drop and by 2004 the intake touched the bottom at 50 gram per per week. Likewise, more than 250 gram per person per week of beef was consumed in 1979, that declined with minor fluctuation and became equal to chicken in 1989 that was 200 gram per person per week. This also declined to 100 gram per person per week in 2004. About fish; its consumption was minimum as compared to three other meats with approximately 60 gram per person per week that slightly dropped i n the following year and almost remained stable till 2004. “
Check your work
We should now have some time to review our work for errors and determine whether there are any areas where we can improve. This is a crucial stage, so try to leave at least 3 to 4 minutes at the end to review and make any necessary improvements.
When we review our work, we ought to:
Review your grammar and punctuation.
Verify the verb tenses. Do they have the right tense?
Verify the veracity of the data used.
test your vocabulary. Can we eliminate any repetition with synonyms?
Verify your paragraphing.
Check the word count. Over 150?
You should use pencil to write your response so that you can quickly edit it.View the essay draft posted above. Which adjustments would you make?
IELTS Academic Writing Task 1 Sample answer
The given Line graph depicts the information about fish and varied type of meat eaten in a European nation between 1979 and 2004.
Overall, the most noticeable trend is the contradiction in the consumption of chicken with lamb and meat. Where Europeans preference for chicken increased over time, meat and lamb including fish witnessed a drop.
On analysis, Consumption of chicken and land in 1979 was almost equal with 150 gram per person per week. Post 1979, Europeans preference for chicken continue to increase and reached at 250 gram per person per week which was maximum. On the other hand, lamb witnessed a sharp drop and by 2004 the intake touched the bottom at 50 gram per per week. Likewise, more than 250 gram per person per week of beef was consumed in 1979, that declined with minor fluctuation and became equal to chicken in 1989 that was 200 gram per person per week. This also declined to 100 gram per person per week in 2004.
About fish; its consumption was minimum as compared to three other meats with approximately 60 gram per person per week that slightly dropped i n the following year and almost remained stable till 2004.
Now check the following things-
1- Whether the opening is clear
2- Paraphrasing is clearly and accurately done
3- Are paragraphs well structured and connected ?
4- Is information well connected?
5 – All the data is accurately and precisely presented.
6 – is comparison done where ever required?
7 – are the details added sufficiently
Conclusion
By adhering to these five easy steps, you can master the IELTS Academic Writing Task 1. You will succeed if you comprehend the assignment, plan your essay well, write a compelling introduction, give an informative overview, and back up your analysis with precise information and language. Remember to put your writing skills into regular practise and ask for feedback. You can excel in the IELTS Academic Writing Task 1 and get the score you want with commitment and consistent effort. Good fortune!
-
 IELTS Preparation- General Training Combo (Comprehensive Course for 8777)Product on sale₹1,499.00
 -
 IELTS Academic Reading E-book – A Book With Actual Reading Tests- 2024 EditionProduct on sale₹799.00
 -
 IELTS Material (Academic) – A Comprehensive 8 Band Material (All Modules In one)Product on sale₹1,499.00
 -
 IELTS Writing Task 1 (General Training) 8 band writing guide (2024 Edition) Actual IELTS Practice questionsProduct on sale₹799.00
 -
 IELTS Writing task 2(Academic)- The ultimate 8 band Guide (2024 Edition ) Actual IELTS Practice questionsProduct on sale₹999.00
 -
 IELTS writing (Academic) -A complete 8 band writing guide (2024 Edition )Product on sale₹999.00
 -
 IELTS Academic Reading – Real Reading practice tests (Volume- 2) 2024Product on sale₹499.00
 -
 Best IELTS Academic Reading – Actual Reading Tests (Volume-1) 2024Product on sale₹349.00
 -
 IELTS 8 Band Prodigy Pack – IELTS Complete Prep E-books (General Training)Product on sale₹799.00