Your cart is currently empty!
Academic Writing Task 1 sample 2

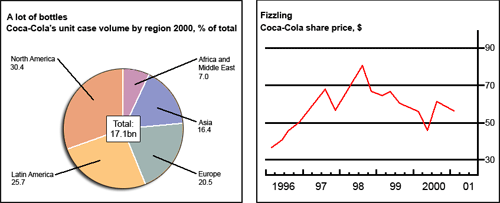
The chart and graph below give information about sales and share prices for Coca-Cola.
Write a report for a university lecturer describing the information shown below.
» You should write at least 150 words.
» You should spend about 20 minutes on this task.

Sample Answer
The pie chart and line graph reveal the global sales ratio of Coca-Cola in 2000 and its share price between 1996 and 2001.
Overall, It is apparently seen that America was the largest market for this brand. Also the share price of coca cola witnessed an increasing trend despite a minor drop and it was highest in 1998.
According to the pie chart, Coca-Cola sold 17.1 billion unit case in the year 2000 and more than 55% of this sale was made in North and Latin America collectively, latin america being higher compared to the former. Further, They sold around 20.5 billion unit case in Europe, which was their third largest sales ratio. Asian consumers has market of 16% unit case of Coca-Cola in this year and African and the Middle Eastern citizens together consumed 7% of the total sale in 2000.
The line graph shows that the share price of this brand was $36 in 1996 and it rapidly increased in the following years. Except in the middle of 1997, the price kept on going up until it reached its peak at around $80 per share in 1998. Hereafter, the price gradually declined and went below $50 in early 2000. Finally, the share price of Coca-Cola stood at around $60 during the mid-2000.
[carousel_slide id=’16536′]